pygmt.params.Position
- class pygmt.params.Position(refpoint, cstype=None, anchor=None, offset=None)[source]
Class for positioning embellishments on a plot.
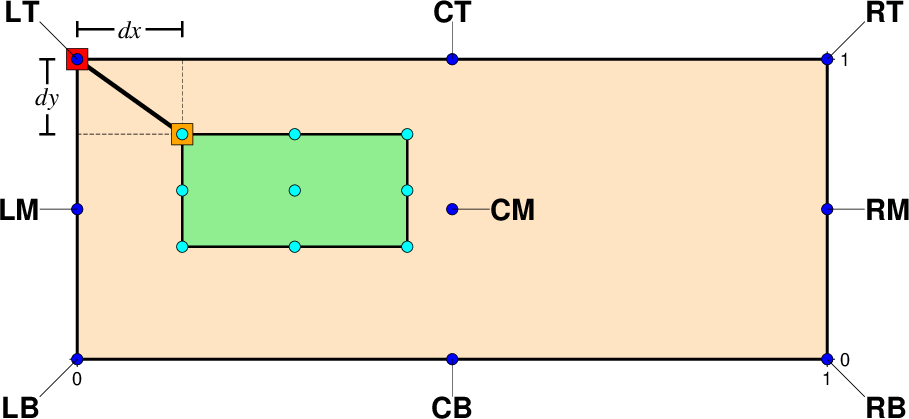
The placement of a GMT embellishment (represented by a green rectangle) in relation to the underlying plot (represented by a bisque rectangle).
This class provides flexible positioning for GMT embellishments (e.g., logo, scale, rose) by defining a reference point on the plot and an anchor point on the embellishment. The embellishment is positioned so these two points overlap.
Conceptual Model
Think of it like dropping an anchor from a boat:
The boat navigates to the reference point (a location on the plot)
The anchor point (a specific point on the embellishment) is aligned with the reference point
The embellishment is “dropped” at that position
Reference Point
The reference point can be specified in five different ways using the
cstypeandrefpointattributes:cstype="mapcoords"Map CoordinatesUse data/geographic coordinates. Specify
refpointas (longitude, latitude). Useful when tying the embellishment to a specific geographic location.Example:
refpoint=(135, 20), cstype="mapcoords"cstype="plotcoords"Plot CoordinatesUse plot coordinates as distances from the lower-left plot origin. Specify
refpointas (x, y) with units (e.g., inches, centimeters, points). Useful for precise layout control.Example:
refpoint=("2c", "2.5c"), cstype="plotcoords"cstype="boxcoords"Normalized CoordinatesUse normalized coordinates where (0, 0) is the lower-left corner and (1, 1) is the upper-right corner of the bounding box of the current plot. Specify
refpointas (nx, ny). Useful for positioning relative to plot dimensions without units.Example:
refpoint=(0.2, 0.1), cstype="boxcoords"cstype="inside"Inside PlotSelect one of the nine justification codes as the reference point. The anchor point defaults to be the same as the reference point, so the embellishment is placed inside the plot.
Example:
refpoint="TL", cstype="inside"cstype="outside"Outside PlotSimilar to
cstype="inside", but the anchor point defaults to the mirror opposite of the reference point. Useful for placing embellishments outside the plot boundaries (e.g., color bars).Example:
refpoint="TL", cstype="outside"
Anchor Point
The anchor point determines which part of the embellishment aligns with the reference point. It uses one of nine justification codes.
Set
anchorexplicitly to override these defaults. If not set, the default anchor behaviors are:cstype="inside": Same as the reference point justification codecstype="outside": Mirror opposite of the reference point justification codeOther cstypes:
"MC"(middle center) for map rose and scale,"BL"(bottom-left) for other embellishments
Offset
The
offsetparameter shifts the anchor point from its default position. Offsets are applied to the projected plot coordinates, with positive values moving in the direction indicated by the anchor point’s justification code. It should be a single value (applied to both x and y) or as (offset_x, offset_y).Examples
Position the GMT logo at map coordinates (3, 3) with the logo’s middle-left point as the anchor, offset by (0.2, 0.2):
>>> import pygmt
>>> from pygmt.params import Position
>>> fig = pygmt.Figure()
>>> fig.basemap(region=[0, 10, 0, 10], projection="X10c", frame=True)
>>> fig.logo(
...     position=Position(
...         (3, 3), cstype="mapcoords", anchor="ML", offset=(0.2, 0.2)
...     ),
...     box=True,
... )
>>> fig.show()
Position the GMT logo at the top-left corner inside the plot:
>>> fig = pygmt.Figure()
>>> fig.basemap(region=[0, 10, 0, 10], projection="X10c", frame=True)
>>> fig.logo(position=Position("TL", cstype="inside", offset="0.2c"), box=True)
>>> fig.show()
-
refpoint:
Sequence[float|str] |Literal['TL','TC','TR','ML','MC','MR','BL','BC','BR'] Location of the reference point on the plot. The format depends on
cstype:cstype="mapcoords": (longitude, latitude)cstype="plotcoords": (x, y) with plot unitscstype="boxcoords": (nx, ny)cstype="inside"or"outside": 2-character justification codes
-
cstype:
Literal['mapcoords','inside','outside','boxcoords','plotcoords'] |None= None cstype of the reference point. Valid values are:
"mapcoords": Map/Data coordinates"plotcoords": Plot coordinates"boxcoords": Normalized coordinates"inside"or"outside": Justification codes
If not specified, defaults to
"inside"ifrefpointis a justification code; otherwise defaults to"plotcoords".
-
anchor:
Literal['TL','TC','TR','ML','MC','MR','BL','BC','BR'] |None= None Anchor point on the embellishment using a 2-character justification code. If
None, defaults are applied based oncstype(see above).