Note
Go to the end to download the full example code.
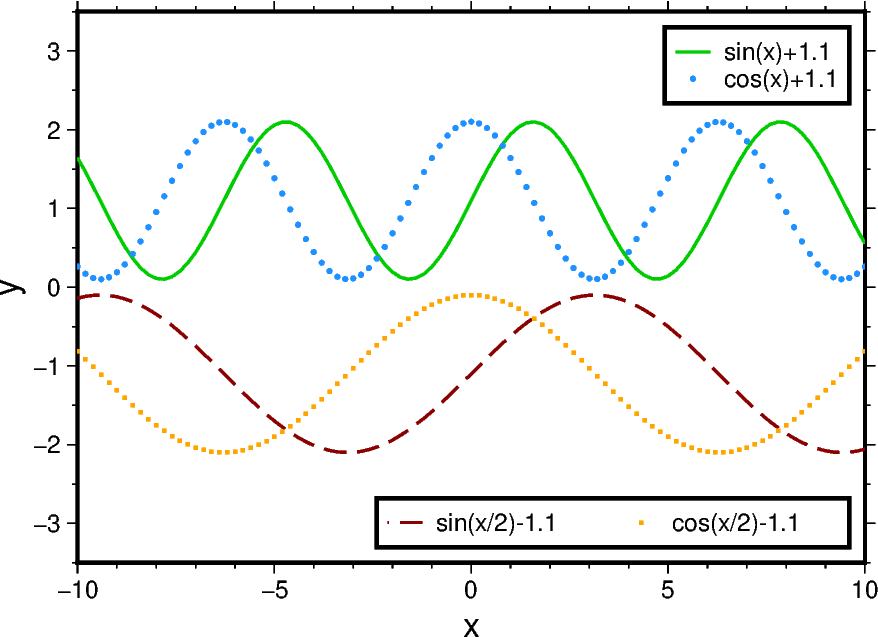
Legend
The pygmt.Figure.legend method can automatically create a legend for symbols
plotted using pygmt.Figure.plot. A legend entry is only added when the label
parameter is used to state the desired text. Optionally, to adjust the legend, users can
append different modifiers. A list of all available modifiers can be found at
https://docs.generic-mapping-tools.org/6.6/gmt.html#l-full. To create a multiple-column legend +N is used with the
desired number of columns. For more complicated legends, users may want to write an
ASCII file with instructions for the layout of the legend items and pass it to the
spec parameter of pygmt.Figure.legend. For details on how to set up such a
file, please see the GMT documentation at https://docs.generic-mapping-tools.org/6.6/legend.html#legend-codes.
import numpy as np
import pygmt
from pygmt.params import Position

# Set up some test data
x = np.arange(-10, 10.2, 0.2)
y1 = np.sin(x) + 1.1
y2 = np.cos(x) + 1.1
y3 = np.sin(x / 2) - 1.1
y4 = np.cos(x / 2) - 1.1

# Create new Figure() object
fig = pygmt.Figure()

fig.basemap(
    projection="X10c/7c",
    region=[-10, 10, -3.5, 3.5],
    frame=["WSne", "xaf+lx", "ya1f0.5+ly"],
)

# -----------------------------------------------------------------------------
# Top: Vertical legend (one column, default)

# Use the label parameter to state the text label for the legend entry
fig.plot(x=x, y=y1, pen="1p,green3", label="sin(x)+1.1")
fig.plot(x=x, y=y2, style="c0.07c", fill="dodgerblue", label="cos(x)+1.1")

# Add a legend to the plot at the Top Right (TR) corner with a 0.2-cm offset in x- and
# y-directions; surround the legend with a box.
fig.legend(position=Position("TR", offset=0.2), box=True)

# -----------------------------------------------------------------------------
# Bottom: Horizontal legend (here two columns)

# +N sets the number of columns corresponding to the given number, here 2
fig.plot(x=x, y=y3, pen="1p,darkred,-", label="sin(x/2)-1.1+N2")

fig.plot(x=x, y=y4, style="s0.07c", fill="orange", label="cos(x/2)-1.1")

# For a multi-column legend, users have to provide the width, here it is set to 6 cm;
# the legend is placed at the Bottom Right (BR) corner.
fig.legend(position=Position("BR", offset=0.2), width="6c", box=True)

fig.show()
Total running time of the script: (0 minutes 0.121 seconds)